Help
The home page displays a summary of key disaster information from across the region, including links to relevant resources.
The site uses locational based information to determine a users distance from disaster/emergency incidents. When using a desktop computer the site will request to access a users location, however often this location is not accurate due to the lack of GPS functionality. To update your location you will note at the bottom of screen there is an option to change your location. This allows a user to set a specific location using the map feature to provide more accurate distance indications. Using the site through a GPS enabled mobile device will result in the most accurate locational based information.
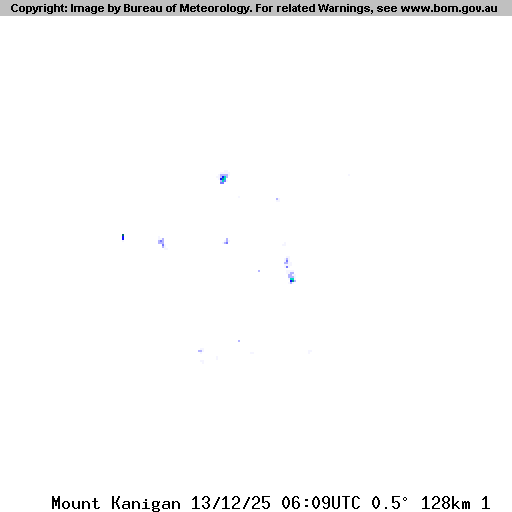
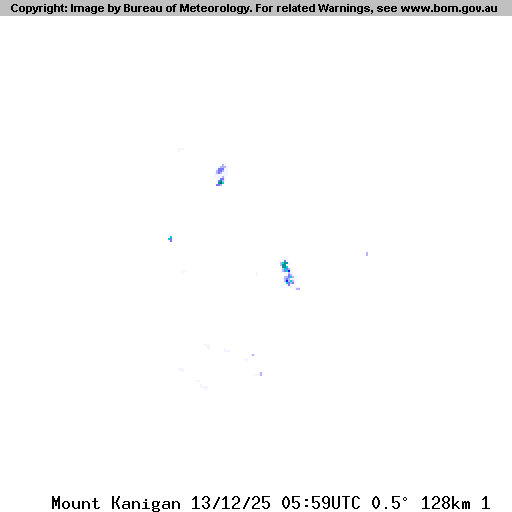
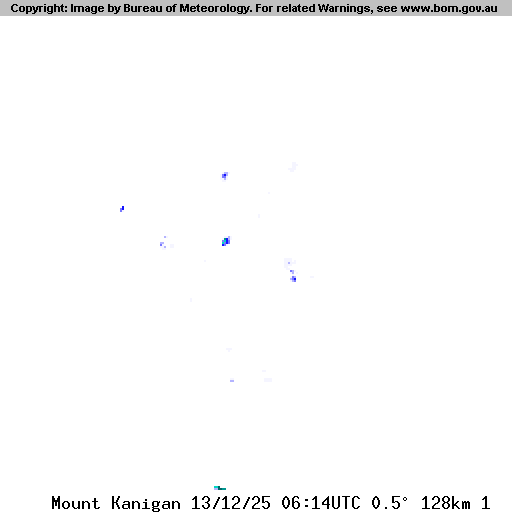
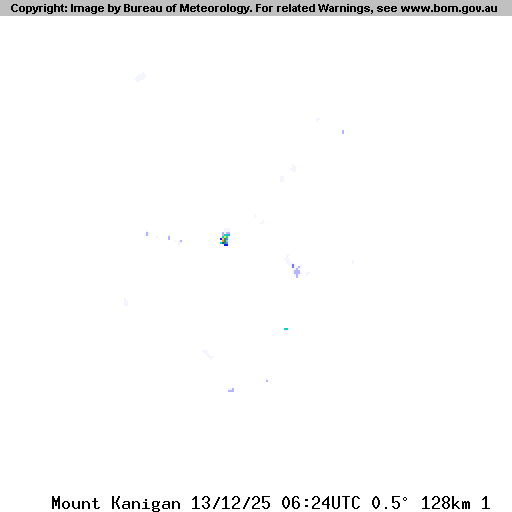
The dashboard provides a high level overview of current weather warnings, closed roads & accidents and unplanned power outages. This page also displays an updated BOM radar of the region.


0
Places of Refuge
Council has identified a number of places of refuge for potential use in the case of an emergency or disaster. For more information visit our Places of refuge page.
0
( 0 Local road )
Closed Roads
Details on road closures as reported by Sunshine Coast Council and the Department of Transport and Main Roads.
0
School Closures
View current school closure information as provided by the Department of Education and Training.
0
Unplanned Power Outages
Current unplanned and emergency power outages as provided by Energex.
0
Warnings
A list of current warnings for the region provided by both council and the Bureau of Meteorology.
Current scheduled power outages as provided by Energex.
View traffic camera images provided by the Department of Transport and Main Roads.
View weather conditions with crowd sourced web camera images.
What is Disaster Hub?
Sunshine Coast Councils Disaster Hub brings together disaster and hazard related information from within Council and external sources, building community disaster resilience, raising community awareness to natural hazards and risks, and protecting communities during disaster events.
Disaster Hub provides comprehensive, centralised and real-time data for collection and analysis by accessing Councils geospatial layers and external open source data feeds. The platform is intuitive, easy to use and can identify multiple types of hazard risks to improve disaster resilience and mitigate risks associated with disaster events.
Providing up to the minute information and intelligence, essential information for the community, emergency service agencies and Council to ensure that the best decisions are made before, during and after disaster or emergency events.
BOM Radar
Weather Forecast


What to do During a Disaster or Emergency
When disaster strikes you need to follow the advice of authorities on staying put or evacuating and follow your emergency plan.
- Stay calm
- Follow your prepared emergency plans
- Tune into a local ABC or commercial radio station to stay informed
- Follow instructions from authorities promptly
Here are some handy rules of thumb to use for certain types of emergencies:
- Cyclone/storm tide - run from water - Shelter in place from wind
- Riverine flooding - stay with friends in high places
- Bushfire - if you are going to leave, leave early
- Hazardous material accident - stay upwind or stay inside
- Tsunami - go inland one kilometre or go up ten metres
- Dam release - get out and move to higher ground quickly
Map Help
The map page provides the user with a graphical interface of key disaster related information across the Sunshine Coast region.
Map features
The map features toolbar located on the left of screen provides the user with an interface to interact with different display features. This toolbar is collapsible by select the down arrow (v). A user can also zoom in or out of the map, as well as select the street view function on bottom right of screen.
Each feature has ‘radio button’ (o) that is used to select/deselect displaying the item on the map. The information icon (i) provides a user with a description of the feature, as well as a display legend where appropriate. A number of the features have been grouped, indicated by an arrow (>), selecting this arrow will expand the group to show the individual features.
Some of the groups/features will indicate a coloured square containing a number. This information is related to the specific’s features display points and legend – for further information select the information icon (i) of the individual display feature.
Hazard maps
This group contains a number of features displaying potential flood levels depending on the severity of the rainfall event.
The riverine flood map - contains four layers which displays the hazards related to four flood event likelihoods:
- Extreme
- Major
- Moderate
- Minor
The storm tide map - displays possible inundation due to a storm tide surge.
The development areas - are areas which have recently been developed and earthworks have occurred, this will affect the extent of flooding. These areas have been removed from the mapping and will be re-included when new regional flood modelling is available that incorporates the as-constructed development terrain information.
- 0 School Closures
- 0 School Closures
- 0 SCC Wind Gauges
- 0 Peak Wind Gusts 1Hr
- 0 Peak Wind Gusts 3Hr
- 0 Peak Wind Gusts 6Hr
- 0 Peak Wind Gusts 12Hr
- 0 Peak Wind Gusts 24Hr
- Hazard Maps
- Extreme Riverine Flood
- Major Riverine Flood
- Moderate Riverine Flood
- Minor Riverine Flood
- Stormtide Flood
- Landslide
- Bushfire
- Earthquake Hazard
- 0 Roads
- 0 Closed Roads
- 0 Flooded Roads
- 0 Other Hazards/Accidents
- Traffic Conditions
- 0 Traffic Cameras
- 0 Flooded Roads (unverified)
- 0 Fire Incidents
- 0 Fire Incidents
- 0 Power Outages
- 0 Unplanned Power Outages
- 0 Planned Power Outages
- 0 Sandbags
- 0 SES sandbagging
- 0 Evacuation Centres
- 0 Places of Refuge
- 189 189 189 189 189 189 Rainfall Summary
- 636363636363 1 Hr Rainfall Summary
- 0 3 Hr Rainfall Summary
- 0 6 Hr Rainfall Summary
- 636363636363 12 Hr Rainfall Summary
- 636363636363 24 Hr Rainfall Summary
- 0 Water Level Gauges
- 0 Water Levels
- 252 252 252 252 252 252 Rainfall Forecast
- 636363636363 1 Hr Rainfall Forecast
- 636363636363 3 Hr Rainfall Forecast
- 0 6 Hr Rainfall Forecast
- 636363636363 12 Hr Rainfall Forecast
- 636363636363 24 Hr Rainfall Forecast
- 0 Earthquakes
- 0 Earthquakes
- 0 Surf Cameras
- 0 Web Cams
- 0 School Closures
- 0 School Closures
- 0 SCC Wind Gauges
- 0 Peak Wind Gusts 1Hr
- 0 Peak Wind Gusts 3Hr
- 0 Peak Wind Gusts 6Hr
- 0 Peak Wind Gusts 12Hr
- 0 Peak Wind Gusts 24Hr
- Hazard Maps
- Extreme Riverine Flood
- Major Riverine Flood
- Moderate Riverine Flood
- Minor Riverine Flood
- Stormtide Flood
- Landslide
- Bushfire
- Earthquake Hazard
- 0 Roads
- 0 Closed Roads
- 0 Flooded Roads
- 0 Other Hazards/Accidents
- Traffic Conditions
- 0 Traffic Cameras
- 0 Flooded Roads (unverified)
- 0 Fire Incidents
- 0 Fire Incidents
- 0 Power Outages
- 0 Unplanned Power Outages
- 0 Planned Power Outages
- 0 Sandbags
- 0 SES sandbagging
- 0 Evacuation Centres
- 0 Places of Refuge
- 189 189 189 189 189 189 Rainfall Summary
- 636363636363 1 Hr Rainfall Summary
- 0 3 Hr Rainfall Summary
- 0 6 Hr Rainfall Summary
- 636363636363 12 Hr Rainfall Summary
- 636363636363 24 Hr Rainfall Summary
- 0 Water Level Gauges
- 0 Water Levels
- 252 252 252 252 252 252 Rainfall Forecast
- 636363636363 1 Hr Rainfall Forecast
- 636363636363 3 Hr Rainfall Forecast
- 0 6 Hr Rainfall Forecast
- 636363636363 12 Hr Rainfall Forecast
- 636363636363 24 Hr Rainfall Forecast
- 0 Earthquakes
- 0 Earthquakes
- 0 Surf Cameras
- 0 Web Cams